

Cost-Effective Analytics: Elevating Speed and Cutting Down Tableau Costs
Problem Statement
As adoption grew, the client needed a more cost-effective analytics stack to reduce licensing costs while fixing sluggish dashboard performance and poor interactivity.
Client Info
A $30M ARR SaaS product focused on processing large-scale travel and tourism data.
Outcomes
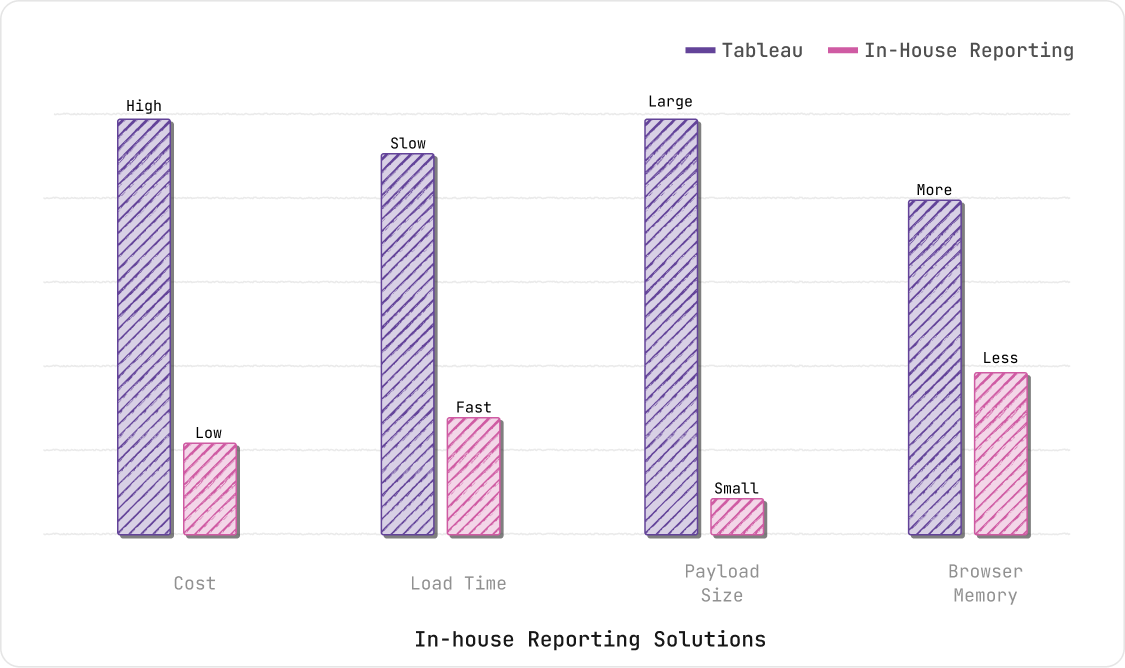
Average load time reduced from 6s to 1.5s
25% lower browser RAM usage
Saved $1.2M in Tableau licenses
How did BeautifulCode do it?
We kicked off by researching alternatives for Tableau and identified various options including low-cost tools such as Power BI, Looker, Sisense, and open-source solutions such as Metabase, Apache Superset, and Redash.
We assessed these options based on the following criteria:
- Ease of customising reportsW
- Support for various visualizations such as Geo Chart, Area charts, and TreeMapsW
- Compatibility with BigQuery data sourceW
- Efficient load time and smooth interactivity.
All of these choices exhibited poor performance, marked by extended loading durations and a notable absence of interactivity throughout the loading process.
We executed a thorough browser profiling of the Tableau visualisations to ascertain the fundamental reasons behind its performance issue. It turned out that the slow loading is caused by the rendering overhead added by iframes loading and the high data load times from the backend data systems. The slow data loading is due to inefficiencies in query execution and processing.
Our Analysis concluded that building a custom in-house solution will not only be cost effective but also solves the performance issues with iframes and data load times. This involves transitioning to a React SPA and optimising data querying and processing.
Enhanced Rendering Model:
The React SPA model utilises a virtual DOM for rendering, resulting in significant performance improvements. We built configurable visualisation components leveraging the capabilities of chart.js, leaflet.js, and D3.js. This approach enhanced the tailoring of reports, providing users with increased flexibility in presenting specialised data insights using GeoCharts, TreeMaps, etc..
Optimised Data Pipeline:
The pipeline involved retrieving data from BigQuery, employing a Redis store for efficient caching, and implementing concurrent data retrieval and transformation using GoLang Routines. This optimised the entire data processing workflow, resulting in substantial reduction in data loading times.
No-Code Dashboard Configuration:
By introducing a no-code solution for dashboard configuration, we empowered various user personas to define and customise dashboards effortlessly.
Technologies Used
© 2025 BeautifulCode. All rights reserved.